
Quick Summary
- CRM metrics show how effectively customer relationships and sales processes are performing: A well-structured CRM database provides the foundation for tracking both operational CRM execution and analytical CRM reporting.
- Not every CRM metric should be a KPI: A metric becomes a key performance indicator when it is directly tied to an important business objective and its movement can influence a decision or action.
- Clear definitions make CRM reporting reliable: Metrics such as win rate, conversion rate, and retention rate can produce different results depending on the population, timeframe, filters, and denominator used. Define each calculation consistently before comparing performance.
- CRM dashboards should focus on decisions, not every available number: Combine a small set of meaningful KPIs with supporting reports for deeper analysis. Pair related metrics—such as pipeline value with deal age or retention with customer lifetime value—to avoid misleading conclusions.
- CRM analytics turns measurements into useful insights: Comparing trends, segments, funnel stages, and customer cohorts helps explain where performance is improving, where problems exist, and what teams should investigate next.
- Good CRM data is essential for trustworthy metrics: Missing, outdated, duplicated, or inconsistently entered records can distort reports and forecasts, so data quality and CRM adoption should be monitored alongside business KPIs.
What Are CRM Metrics?
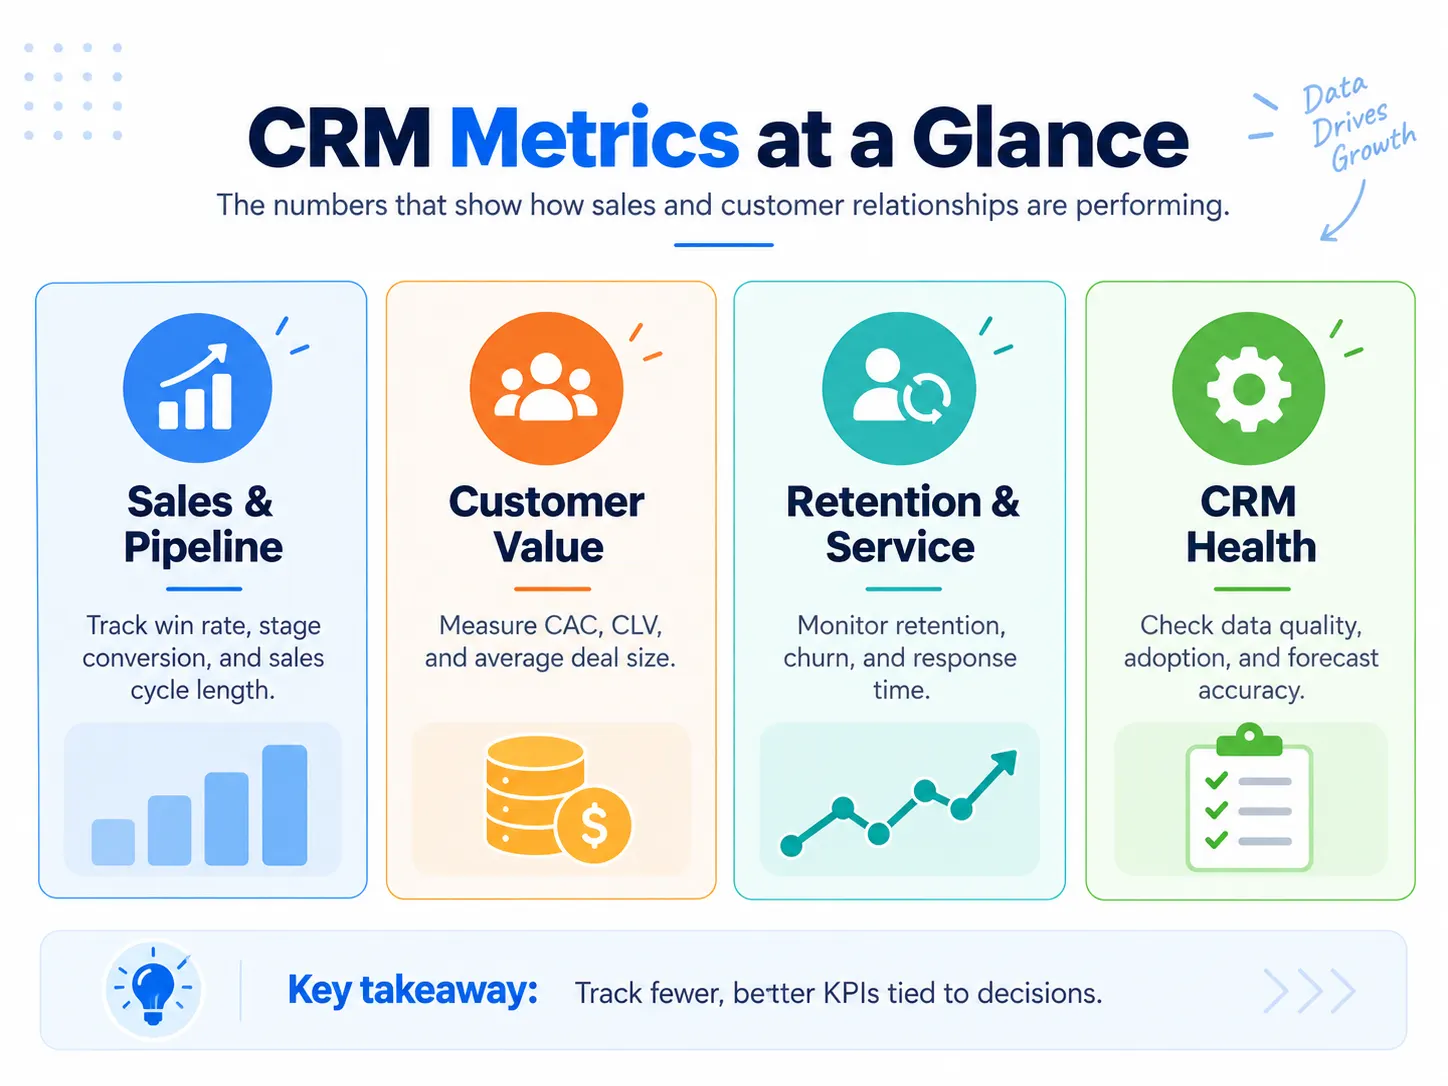
CRM metrics vs KPIs, reports, dashboards, and analytics describe different parts of performance measurement.
| Term | What It Means |
|---|---|
| CRM metric | A measurable value derived from CRM data, such as win rate or sales-cycle length. |
| CRM KPI | A metric selected because it directly indicates progress toward an important objective. |
| CRM report | A structured breakdown of CRM data used to examine performance in detail. |
| CRM dashboard | A visual summary of selected metrics or KPIs, often combining several reports. |
| CRM analytics | The process of analyzing CRM data to identify trends, differences, relationships, risks, or opportunities. |
The distinction matters because collecting a metric does not automatically make it useful. A metric deserves space on a dashboard when a meaningful change in that number could influence a decision.
CRM Metrics and KPIs Worth Tracking
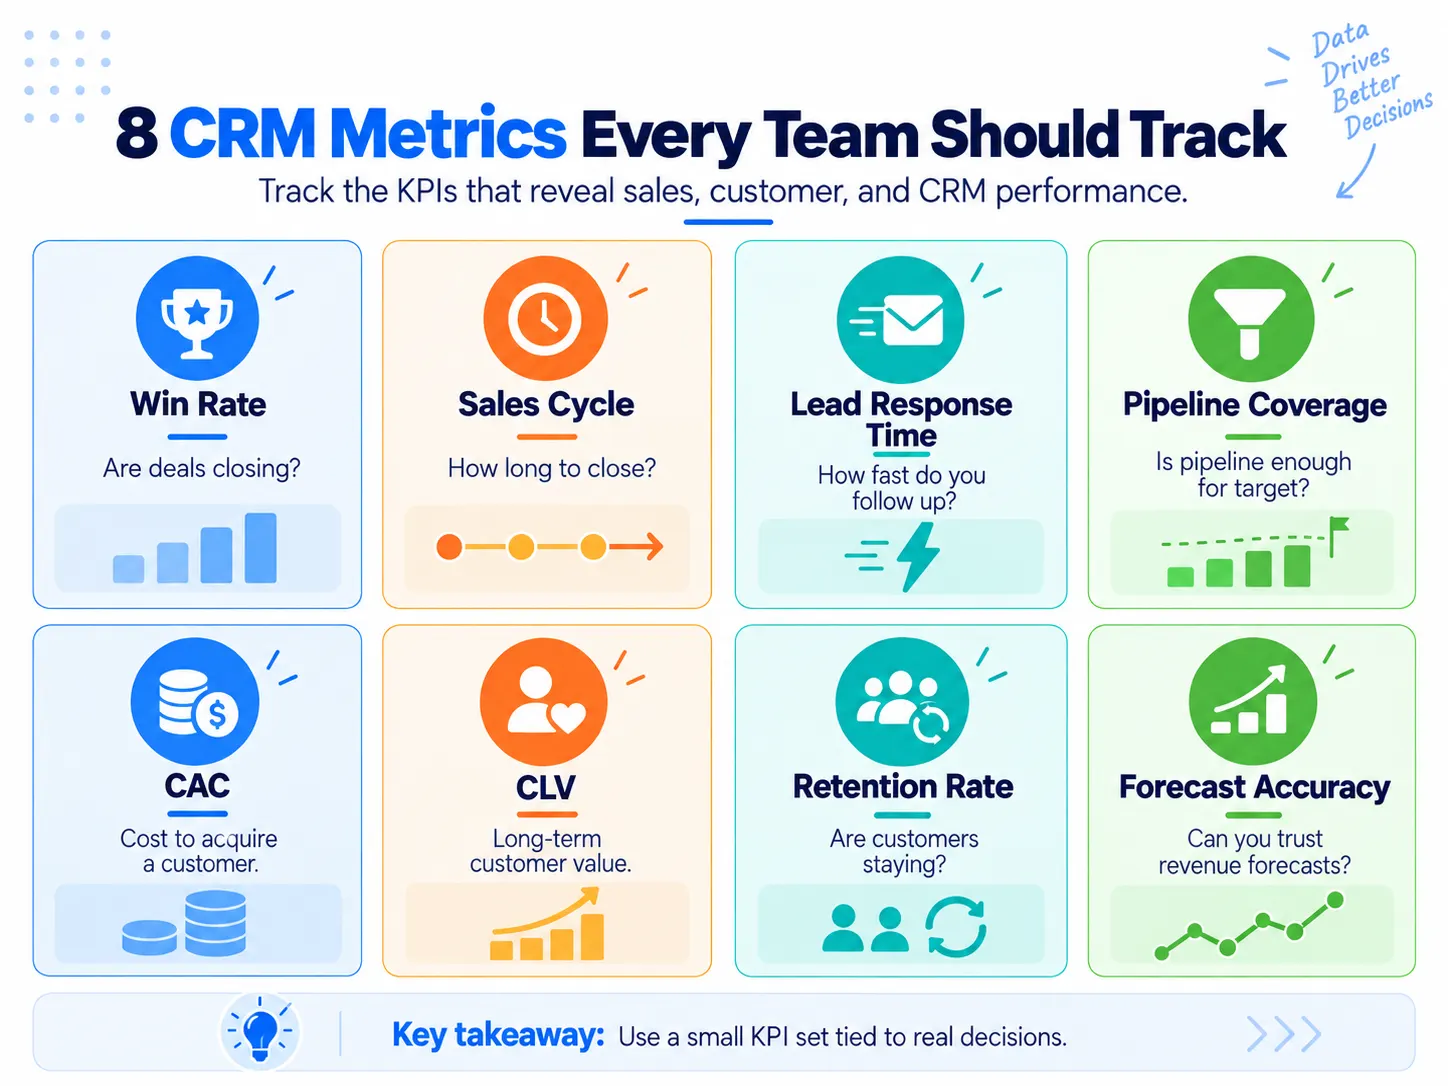
The right CRM KPIs depend on your business model and goals. The following measurements cover the most common questions involving pipeline performance, customer value, retention, service, and CRM reliability.
Sales and Pipeline Metrics
In inside sales and pipeline management, tracking stage conversion and lead response times helps reps prioritize high-intent opportunities before deals stall.
| Metric | How to Measure It | What It Tells You |
|---|---|---|
| Lead response time | Total time to first meaningful response ÷ leads responded to | How quickly new leads receive attention |
| Lead-to-opportunity conversion rate | Opportunities created ÷ leads entering the defined starting population × 100 | How effectively leads become qualified sales opportunities |
| Opportunity win rate | Closed-won opportunities ÷ closed opportunities × 100 | How effectively qualified opportunities become customers |
| Stage conversion rate | Opportunities progressing from a stage ÷ opportunities entering that stage × 100 | Where deals move forward or drop out |
| Sales-cycle length | Average time from a consistently defined starting event to closed-won | How long it takes to close business |
| Pipeline value | Sum of the value of open opportunities in scope | How much potential revenue is currently represented in the pipeline |
| Pipeline coverage | Qualified pipeline value ÷ sales target for the same period | Whether the pipeline is large enough relative to the target |
| Forecast variance | Forecast revenue − actual revenue | How closely forecasts align with eventual results |
The formulas are only useful when their populations are clearly defined.
Win rate is a good example. One business may calculate wins as a percentage of all closed opportunities, while another may measure wins against every opportunity created during a period. Salesforce documents both approaches for different reporting purposes.
Neither number is automatically wrong. The problem occurs when two teams call both measurements “win rate” without documenting the denominator.
The same principle applies to sales-cycle length. Decide whether the clock starts when a lead is created, when it becomes qualified, or when an opportunity is opened, then use that definition consistently.
Pipeline value also needs context. A larger sales pipeline is not necessarily a healthier pipeline if opportunities are old, poorly qualified, or repeatedly stuck in the same stage. Pair pipeline value with stage conversion, deal age, win rate, and sales-cycle length.
Customer Value and Retention Metrics
| Metric | Typical Formula | What It Tells You |
|---|---|---|
| Customer acquisition cost (CAC) | Total sales and marketing acquisition costs ÷ new customers | Average cost of acquiring a customer |
| Customer lifetime value (CLV) | Depends on the business model | Expected economic value of a customer relationship |
| Customer retention rate | (Customers at end − new customers acquired) ÷ customers at start × 100 | Percentage of starting customers retained |
| Customer churn rate | Customers lost ÷ customers at start × 100 | Percentage of customers lost |
| Net Promoter Score (NPS) | % promoters − % detractors | Survey-based indicator of customer advocacy |
A common CAC calculation divides relevant sales and marketing acquisition costs by the customers acquired during the same measurement period.
CLV requires more care because there is no single formula suitable for every business. Salesforce, for example, describes a model based on revenue, customer lifespan, and cost to serve. For a simple transactional model, purchase value, purchase frequency, and expected lifespan may be enough; subscription and account-based businesses may need a different approach.
For retention, a useful formula removes newly acquired customers from the ending customer count before comparing it with the population present at the beginning of the period:
Retention rate = ((ending customers − new customers) ÷ starting customers) × 100
This prevents new acquisition from making retention look stronger than it really is.
Churn measures the other side of the relationship:
Churn rate = customers lost ÷ customers at start × 100.
For NPS, the official Net Promoter System uses a 0–10 recommendation question. Scores of 9–10 are promoters, 7–8 are passives, and 0–6 are detractors. NPS equals the percentage of promoters minus the percentage of detractors.
Customer Service Metrics
A CRM can also track service performance when support interactions or cases are recorded in the system.
Useful measures include:
- first-response time;
- average resolution time;
- open case volume;
- reopened cases;
- customer satisfaction;
- cases by customer or account.
Do not turn a general CRM dashboard into a complete contact-center dashboard. The relevant CRM question is usually whether customer issues are being resolved efficiently and whether service problems are associated with churn, renewal risk, or account value.
CRM Data and Adoption Metrics
Business KPIs are only as reliable as their underlying CRM records. Developing team-wide CRM system proficiency ensures users follow data standards, avoid duplicate records, and log activities accurately.
| Metric | How to Measure It | What It Tells You |
|---|---|---|
| Data completeness rate | Records meeting required data standards ÷ records in scope × 100 | Percentage of records with critical fields populated |
| Stale-record rate | Records not updated within the defined acceptable period ÷ records in scope × 100 | How much active data is outdated |
| CRM adoption rate | Active expected CRM users ÷ expected CRM users × 100 | User engagement with the CRM system |
These are normally guardrail metrics rather than top-level business KPIs. Their purpose is to tell you whether the data used for revenue, pipeline and customer reporting can be trusted.
How to Choose CRM KPIs That Actually Matter?
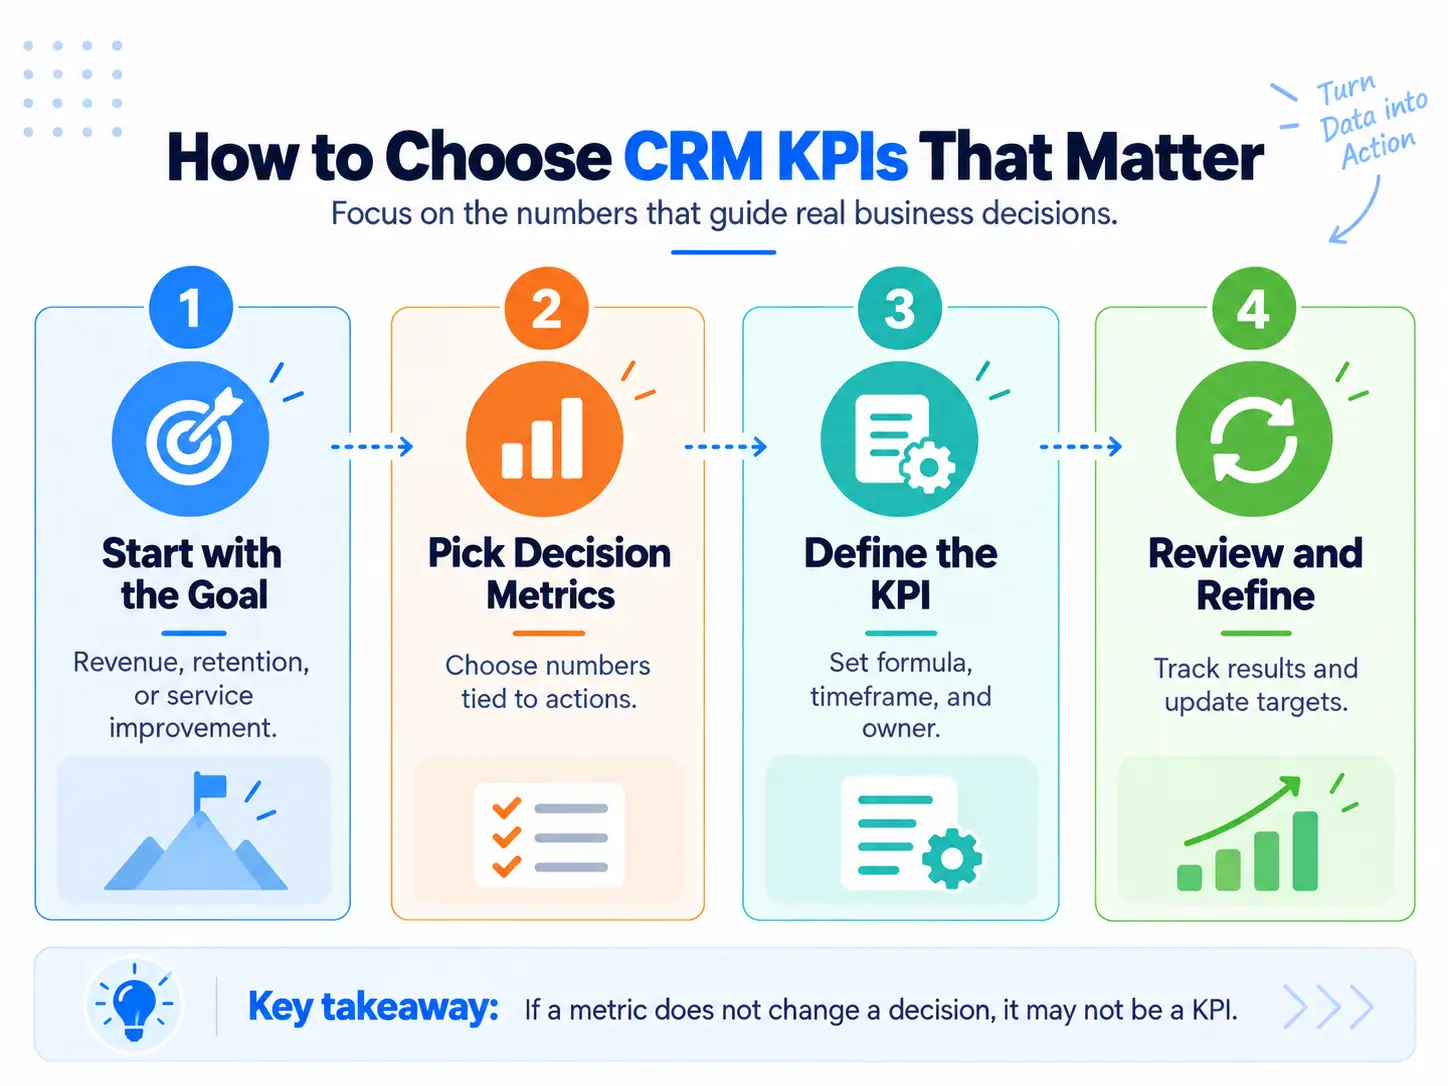
Do not begin by asking:
What metrics can my CRM show?
Begin with:
- What decision do we need this dashboard to support?
- A sales leader trying to judge next-quarter revenue needs different KPIs from a customer-success leader investigating churn.
For every KPI, create a simple metric contract containing:
| Definition Field | What to Specify |
|---|---|
| Business question | What decision or problem does this metric support? |
| Definition | Exactly what the metric represents |
| Population | Which leads, opportunities, customers, cases, or users are included |
| Formula | Numerator and denominator |
| Time period | Day, week, month, quarter, cohort, rolling period, etc. |
| Data source | CRM object, field, integration, survey, finance system, etc. |
| Owner | Who is responsible for the metric definition |
| Breakdowns | Source, salesperson, product, customer tier, region, cohort, etc. |
| Action | What should happen when the metric moves materially? |
This prevents a common reporting problem: two dashboards displaying different answers because their filters, denominators or lifecycle definitions are different.
It also makes KPI selection easier. If nobody can explain what decision follows from a metric moving up or down, it probably does not belong on the primary dashboard.
Pair Leading and Lagging Metrics
Outcome metrics tell you what eventually happened. Earlier indicators help identify what may be driving the outcome.
Useful pairs include:
- lead response time + lead conversion rate;
- stage conversion + win rate;
- pipeline age + sales-cycle length;
- pipeline value + forecast accuracy;
- retention + CLV;
- service-resolution time + churn;
- CRM data completeness + forecast reliability.
The goal is not to prove causation from two dashboard numbers. It is to know where to investigate.
CRM Reports and Dashboards to Build
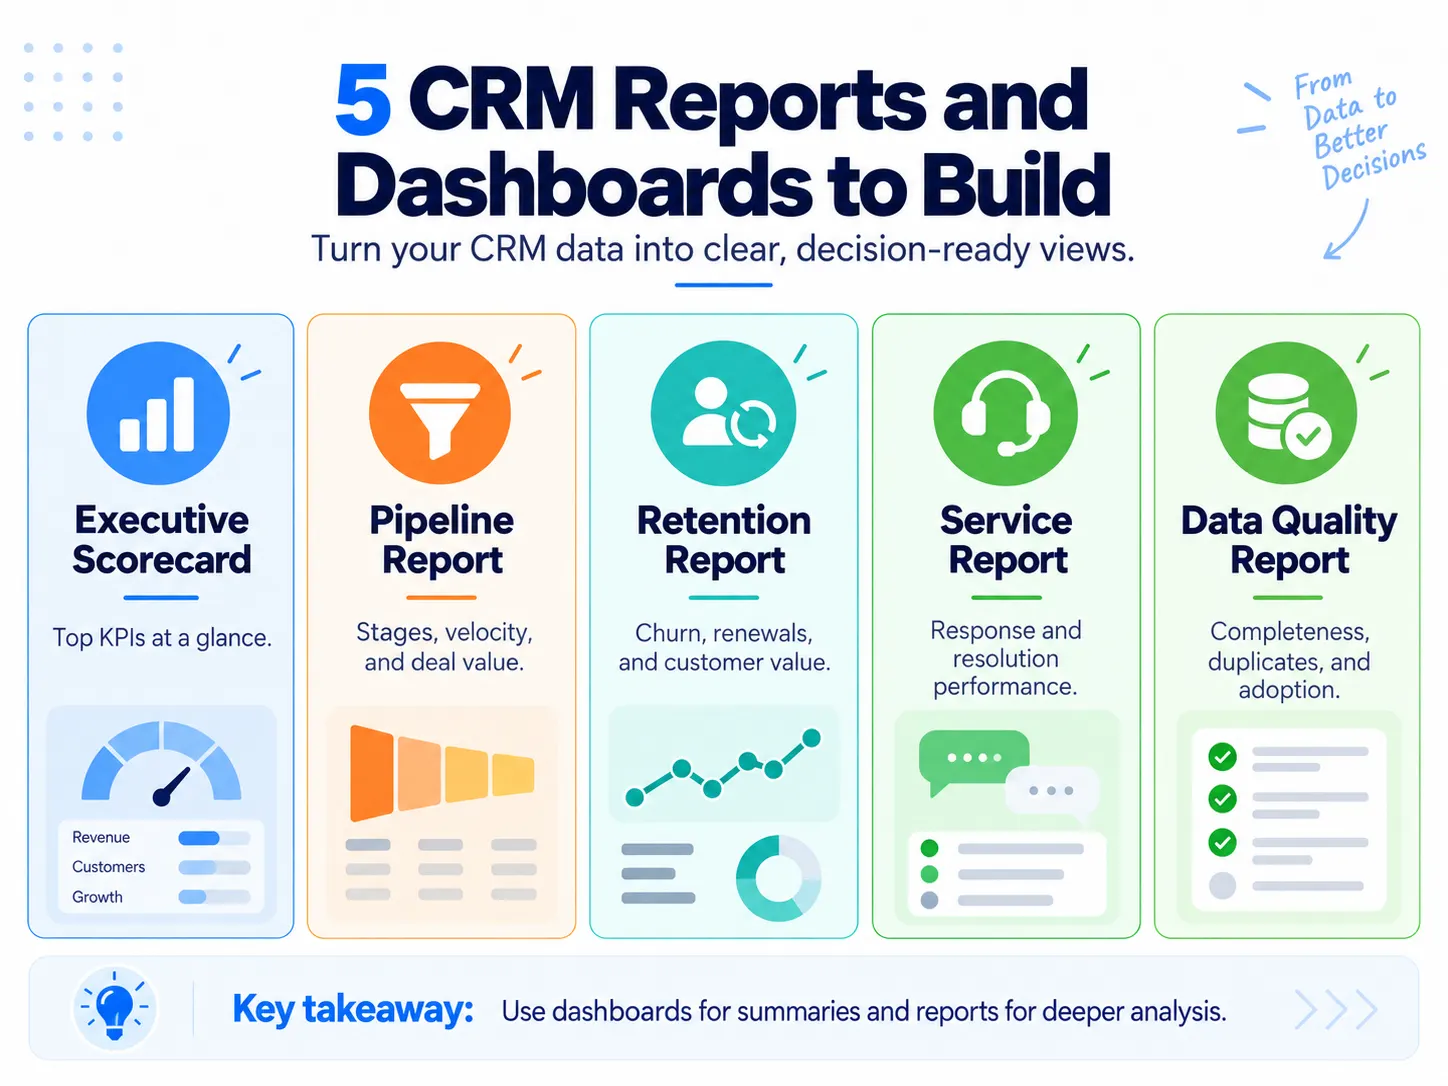
CRM reporting turns individual metrics into views that answer recurring business questions. CRM reports can cover sales pipeline, customer retention, campaign results and other operational areas.
1. Executive KPI Scorecard
Use this for a small group of outcome measures such as:
- revenue or bookings;
- win rate;
- pipeline coverage;
- forecast variance;
- customer retention;
- customer value.
Include current performance, previous-period performance, and the appropriate target or baseline.
2. Pipeline and Funnel Report
Show:
- opportunities by stage;
- pipeline value;
- stage conversion;
- stage aging;
- win/loss rate;
- average deal size;
- sales-cycle length;
- expected close period.
This report answers more than “How much pipeline do we have?”
It should help answer:
Where is pipeline moving, where is it getting stuck, and how much of it is realistically progressing?
3. Customer Retention and Value Report
Combine:
- customer retention;
- churn;
- CLV;
- renewals;
- account value;
- customer satisfaction where available.
For recurring service businesses or agency teams, tracking retention and client engagement in a client management system provides deep visibility into account health.
Segment the report by useful dimensions such as acquisition cohort, customer tier, product or account segment instead of relying only on company-wide averages.
4. Service Performance Report
Include the few service measurements relevant to the customer relationship, such as:
- unresolved cases;
- response time;
- resolution time;
- repeat issues;
- customer satisfaction.
Detailed contact-center operational reporting belongs in a dedicated service dashboard.
5. CRM Data Quality and Adoption Report
Track:
- incomplete records;
- stale opportunities;
- missing close dates;
- missing lifecycle stages;
- duplicate records;
- CRM usage;
- other fields required by the organization's KPI definitions.
This dashboard is particularly useful when business leaders distrust the numbers coming from the CRM.
How CRM Analytics Turns Metrics Into Decisions?
A metric tells you what number changed. CRM analytics helps investigate where, when, and why the change may have occurred.
A practical analysis usually involves one or more of five approaches.
Trend Analysis
Compare the same metric over consistent periods.
Instead of asking only:
What is our win rate?
ask:
How has win rate changed over the last six quarters?
Segmentation
Break the metric into meaningful groups.
For example:
- win rate by lead source;
- sales cycle by salesperson;
- retention by customer tier;
- churn by acquisition cohort;
- resolution time by issue category.
An average can hide meaningful differences between groups.
Funnel Analysis
Examine movement between stages rather than only the final result.
If lead volume is stable but revenue falls, stage-level conversion may reveal where performance changed.
Cohort Analysis
Group customers by a shared starting point, such as acquisition month or quarter, and compare how those groups behave over time.
This is particularly useful when a company is growing quickly because aggregate customer numbers can hide weakening retention among newer customers.
Paired-Metric Analysis
Never assume that one improving KPI means overall performance improved.
For example:
- Pipeline value up + pipeline age up: more pipeline may simply include more stalled opportunities.
- Win rate up + sales cycle much longer: higher conversion may have come with slower deal velocity or a changed opportunity mix.
- Retention stable + CLV down: customers may still be staying while spending less.
- Sales activity up + win rate unchanged: additional activity has not yet translated into better outcomes.
- These combinations are investigation signals, not automatic causal explanations.
For deeper coverage of predictive models, analytical CRM, data preparation and advanced customer analysis, that belongs under customer relationship management analytics, not this metric guide.
CRM Metric Mistakes That Make Reports Misleading
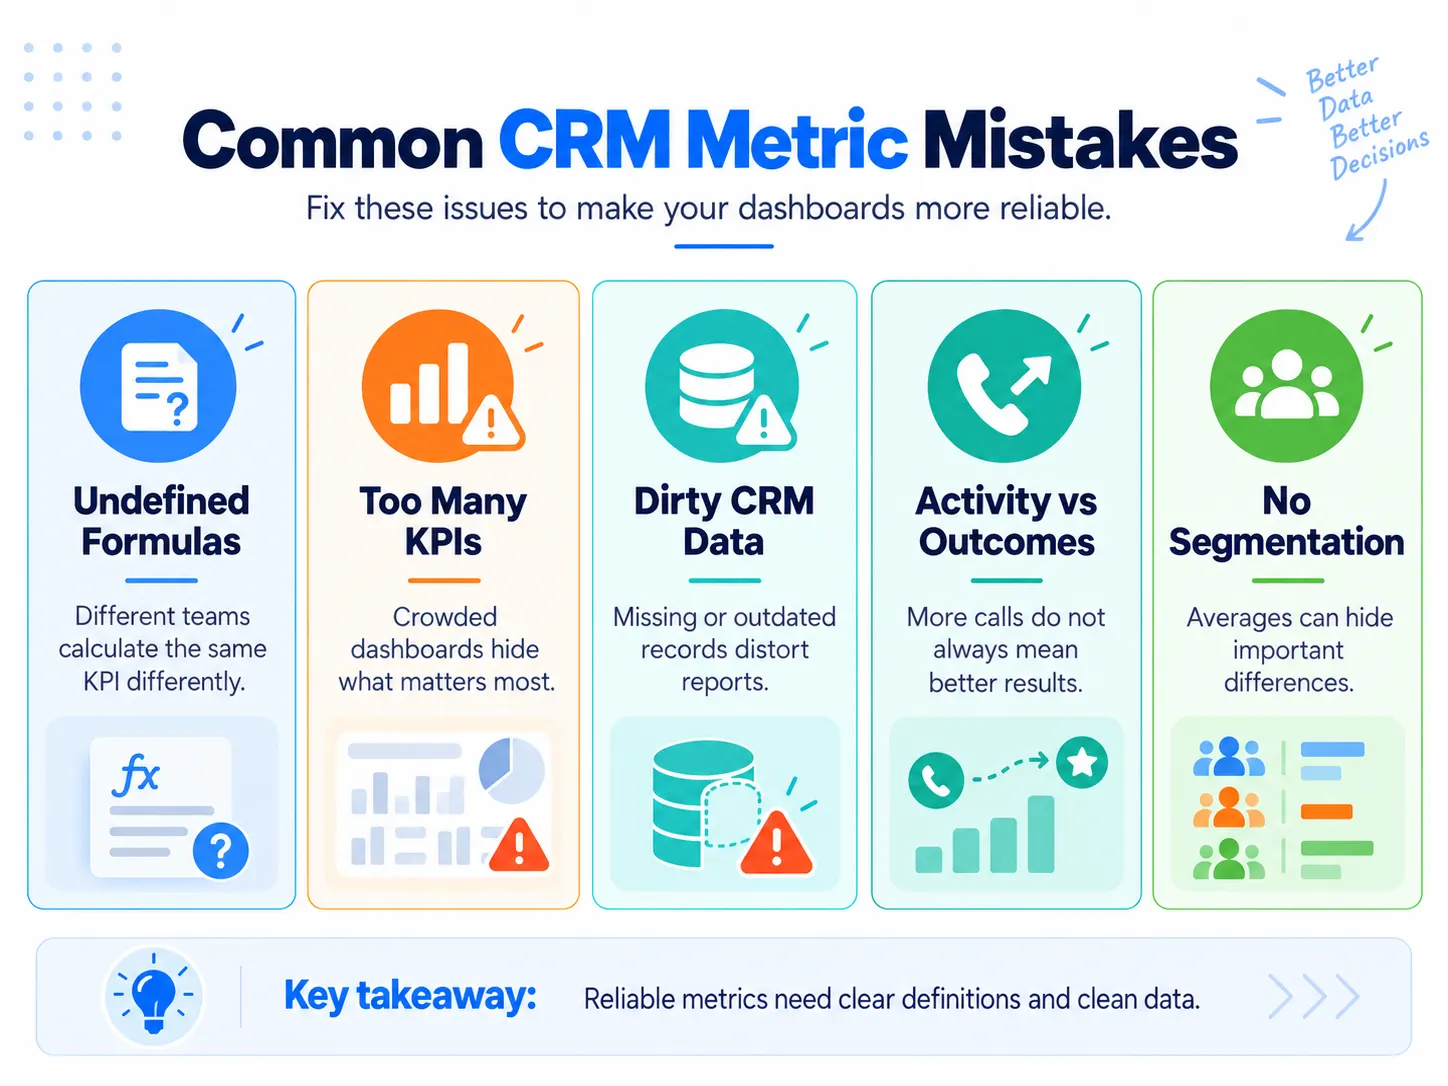
Using an Undefined Denominator
“Conversion rate,” “win rate,” and similar labels can represent different populations.
Define exactly who enters the calculation.
Changing Lifecycle Definitions Without Restating the Metric
If an opportunity stage, qualification rule or definition changes, historical comparisons may no longer be like-for-like.
Comparing Different Time Windows
Monthly, quarterly, cohort-based and rolling-period metrics answer different questions. Label the period explicitly.
Trusting Dirty CRM Data
A dashboard cannot correct missing, stale or inconsistently entered source records by itself.
CRM reporting guidance likewise identifies clean and accurate CRM data as a fundamental reporting challenge.
Treating Activity as an Outcome
Calls made, emails sent and tasks completed can be useful operating indicators.
They do not automatically demonstrate better customer or revenue outcomes.
Pair activity measures with conversion, pipeline progression, retention or another result.
Tracking Too Many KPIs
A CRM can expose hundreds of possible measurements. That does not mean they belong on one dashboard.
Use detailed reports for investigation and reserve the primary dashboard for measures that affect recurring decisions.
Using Generic Benchmarks Without Context
A good win rate, sales cycle, CAC or churn rate depends on the business model, market, customer segment, price point and measurement definition.
Start with your own consistent baseline, compare like-for-like periods and segments, and use external benchmarks only when the methodology is comparable.
A CRM metric earns dashboard space when its definition is stable, its data is trustworthy, its context is clear, and a meaningful change in the number can lead to a decision.
Frequently Asked Questions
Which CRM metrics are the most important to track?
The most important CRM metrics are the ones tied directly to your current business goals. For sales teams, these often include win rate, stage conversion, sales-cycle length, pipeline coverage, and forecast accuracy; for customer-focused teams, retention, churn, CLV, and satisfaction may matter more. A metric should become a KPI only when its movement can influence a decision.
How often should CRM metrics be reviewed?
Review fast-moving operational metrics such as lead response time, pipeline movement, and stage conversion at least weekly, while strategic measures such as retention, CLV, and forecast accuracy may be reviewed monthly or quarterly. The appropriate cadence depends on how quickly the metric changes and how quickly your team can act on it.
What is a good benchmark for CRM metrics?
There is no universal benchmark that makes a CRM metric “good.” Win rates, sales cycles, churn, CAC, and other KPIs vary by industry, business model, customer segment, price point, and measurement method. Start with a consistently defined internal baseline, then compare similar periods and segments before relying on external benchmarks.
Is there one CRM engagement rate businesses should track?
No single CRM engagement rate works for every business. Engagement is usually better measured through relevant customer or sales behaviors—such as responses, meetings, follow-ups, stage progression, renewals, or repeat interactions—depending on the customer lifecycle. A top-line engagement score is useful only when the underlying behaviors are clearly defined.
How can CRM metrics improve sales performance?
CRM metrics reveal where the sales process is slowing down or losing opportunities. For example, declining stage conversion can expose a funnel bottleneck, longer deal age can identify stalled opportunities, and slow lead response can highlight a follow-up problem. The metric is useful when it directs attention to something the team can investigate or change.
Why can two CRM dashboards show different results for the same KPI?
Two dashboards can produce different numbers when they use different filters, time periods, lifecycle definitions, or formulas. One win-rate report might divide won deals by closed opportunities while another uses all opportunities created. In automotive dealership environments, combining data across CRM and dealer management system tools also requires unified field definitions. Define the population, formula, timeframe, and source fields consistently before comparing CRM KPIs.